UX & Product Designer
Den Haag in 3D
A tablet interface that lets citizens explore city data on a 3D model of The Hague.
Overview
A 'phygital' installation where citizens explore city data on a 3D model of The Hague, controlled from a tablet that switches projected data layers.
The challenge
Turn complex urban datasets, normally read only by experts, into something anyone can explore and understand.
01 — Problem
Making invisible data visible
- 01
Data accessibility gap
Rich urban datasets exist, but in static, expert-only formats that citizens and policymakers struggle to read.
- 02
Lack of context
Tables and dashboards don't show where things happen, or how traffic, heat and green space relate to each other.
- 03
Passive consumption
People receive city data as reports instead of exploring it themselves, so it rarely leads to insight or discussion.
02 — Research
What exists, and what people want
To design an interactive 3D city map people would actually use, I looked at existing urban data projects and The Hague's own data, then surveyed people on how they use city data and what they would expect from an installation.
- 01
Benchmarking
MIT CityScope and the Kampong Bharu model combine physical models, projection and touch controls.
- 02
Data audit
Datalab The Hague offers open datasets, and 3DBAG provides the 3D buildings.
- 03
Market gap
GIS tools intimidate non-experts, while a 3D model lowers cognitive load.
Survey · 50 respondents
Data people want to see
Most wanted features
Why they would use it
03 — Key insights
Five key insights from the research
Combining the desk research and survey results gave five key insights that shaped the installation.
- 01
Immersive 3D visualisation
Projection and 3D models make city data more engaging and easier to understand.
- 02
Real-time interaction
Touchscreen and modular design allow instant, dynamic data exploration.
- 03
Intuitive layer control
Simple toggles and highlights help users focus on the data that matters most.
- 04
Relevant, time-based data
Shows real-world updates like traffic or construction over time.
- 05
Accessible and inclusive design
Multilingual and easy to navigate for all users.
04 — Personas
A student, a resident and a city planner
Three personas turned the research into concrete user stories with different goals for the same city data.
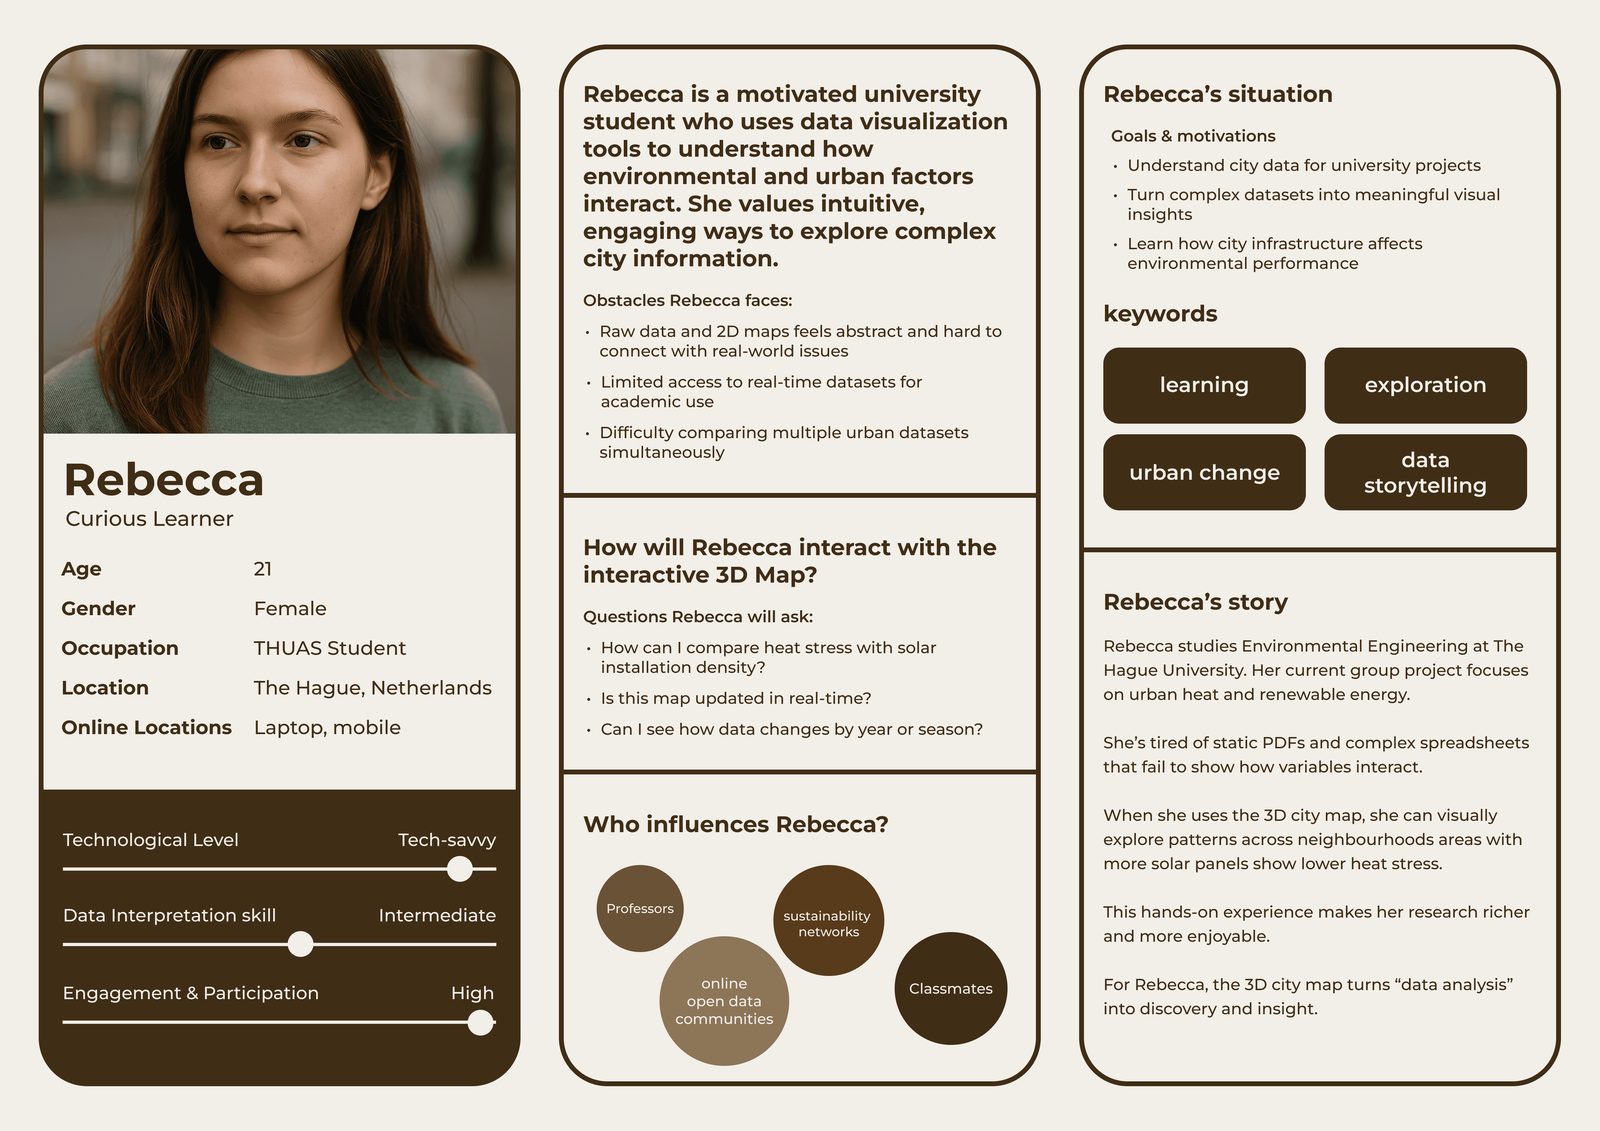
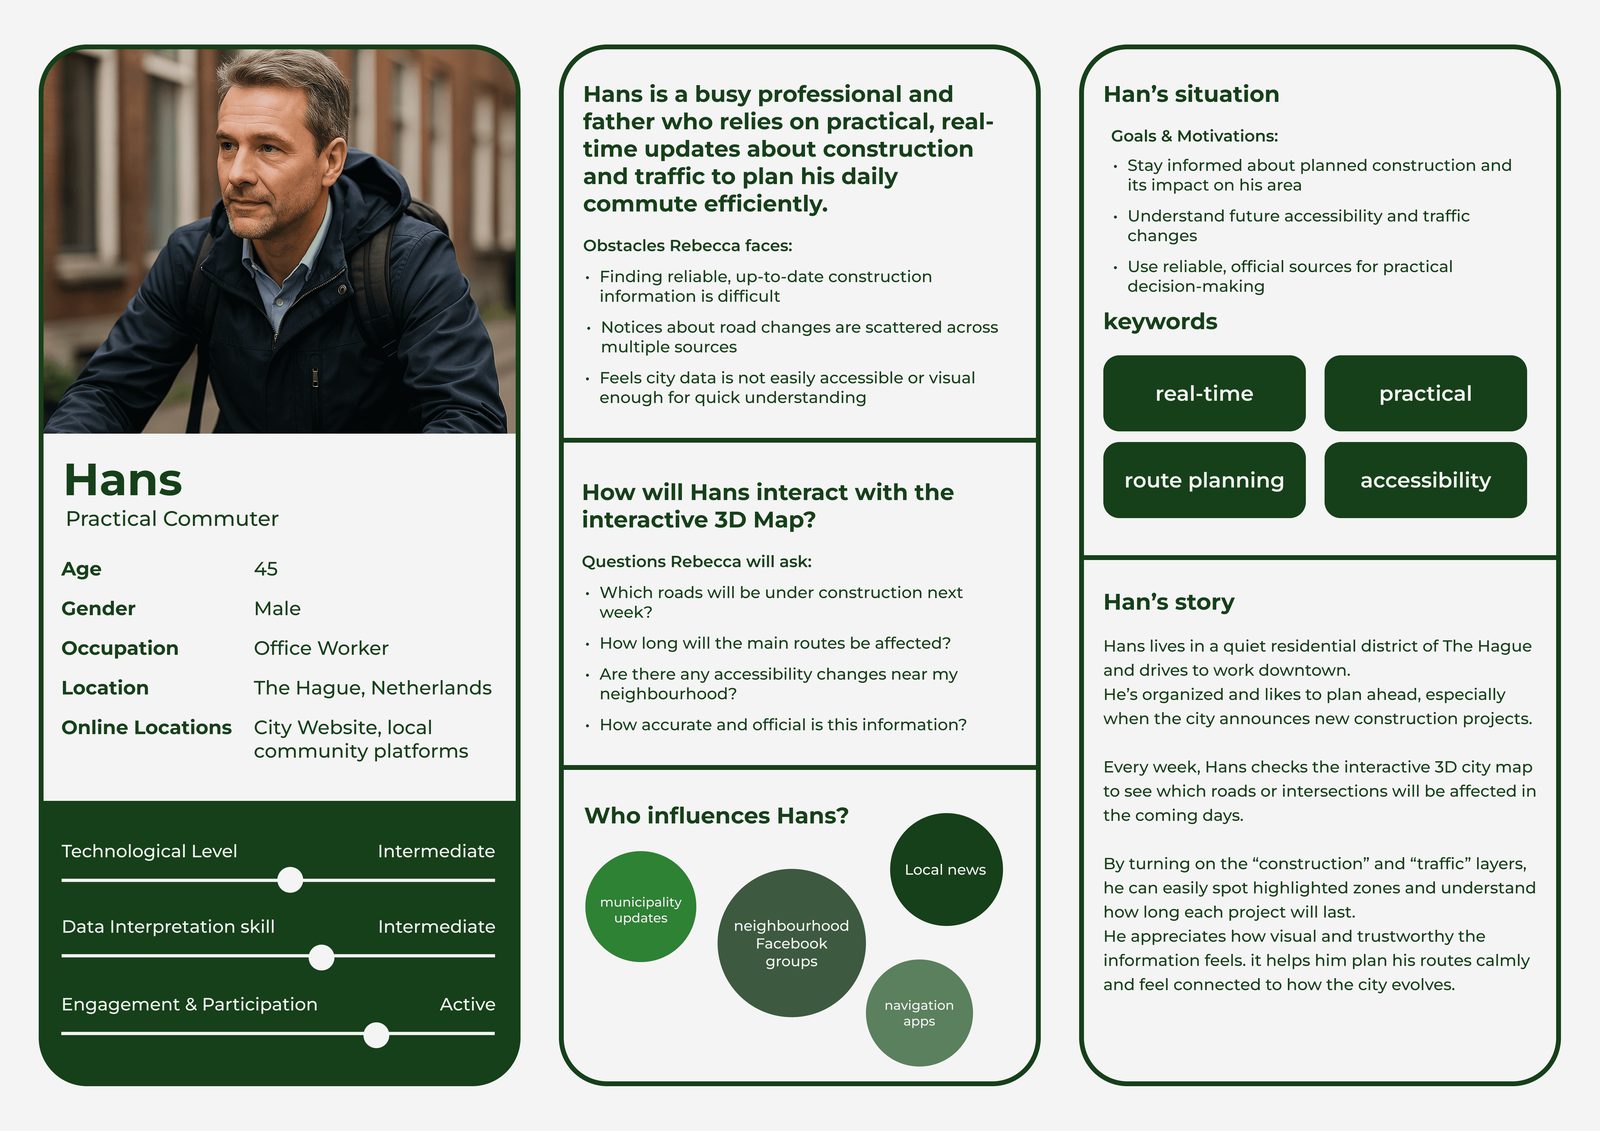
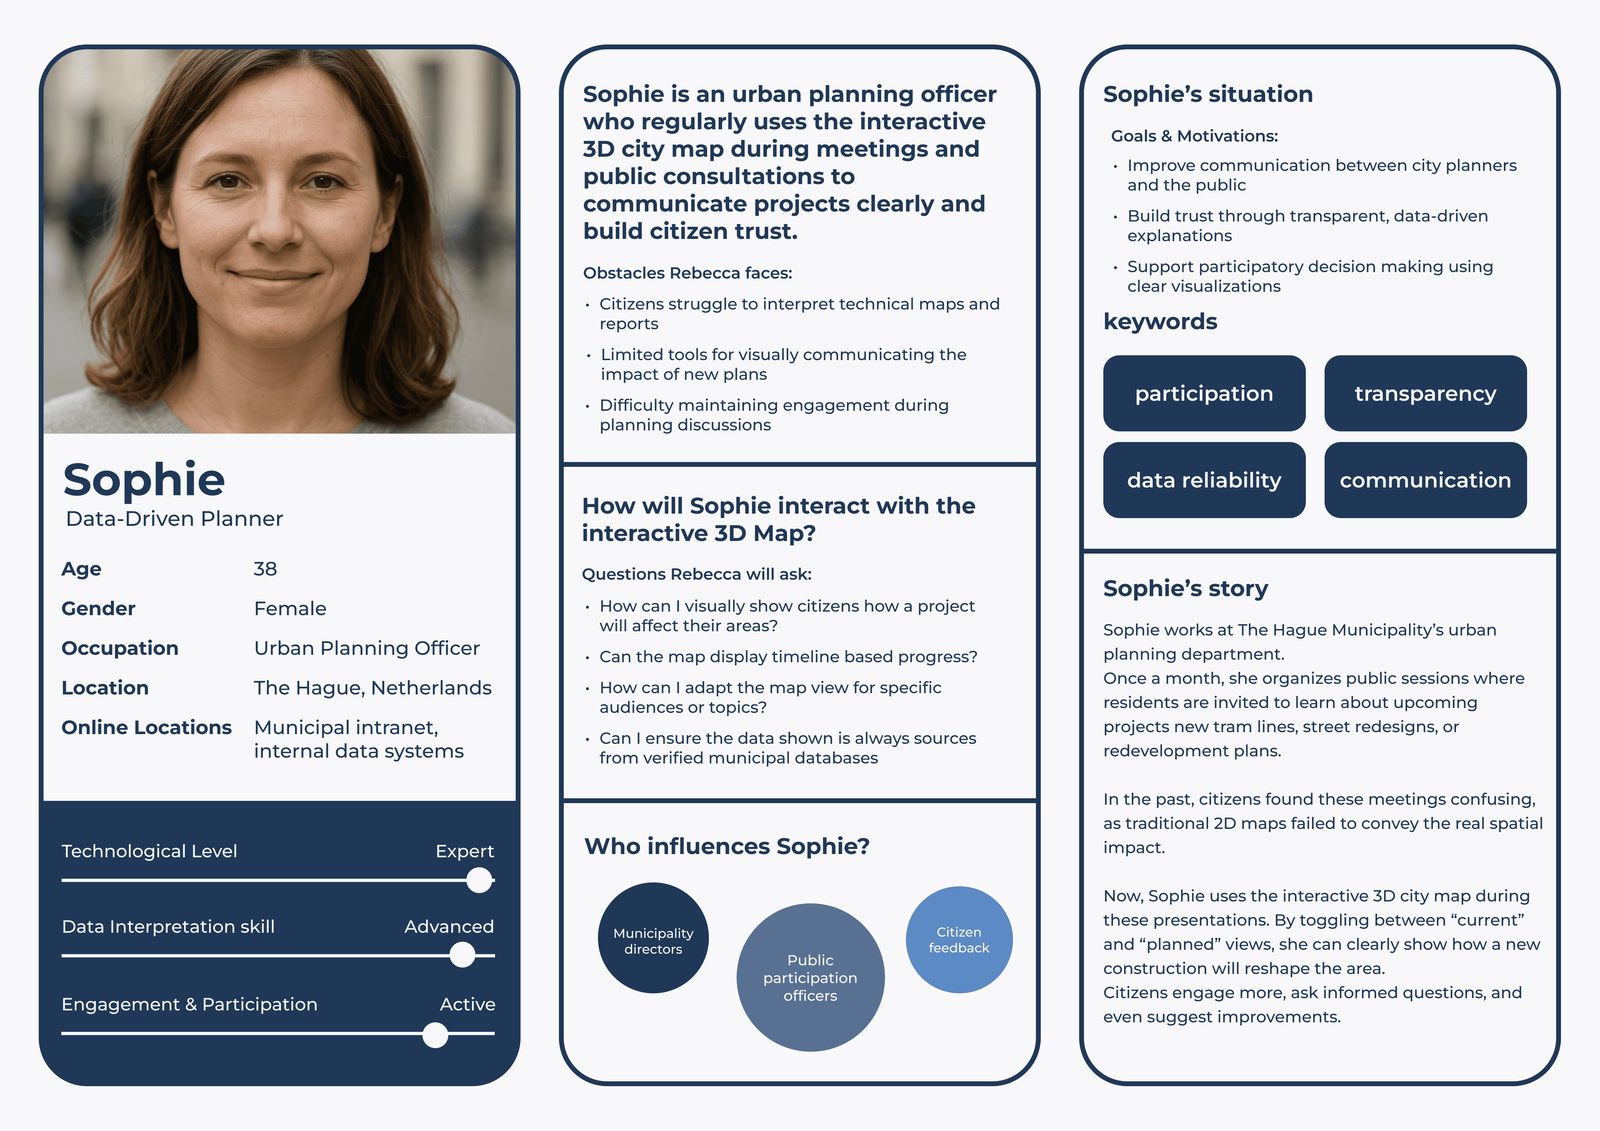
Scroll sideways →
05 — Ideation
From dozens of ideas to one system
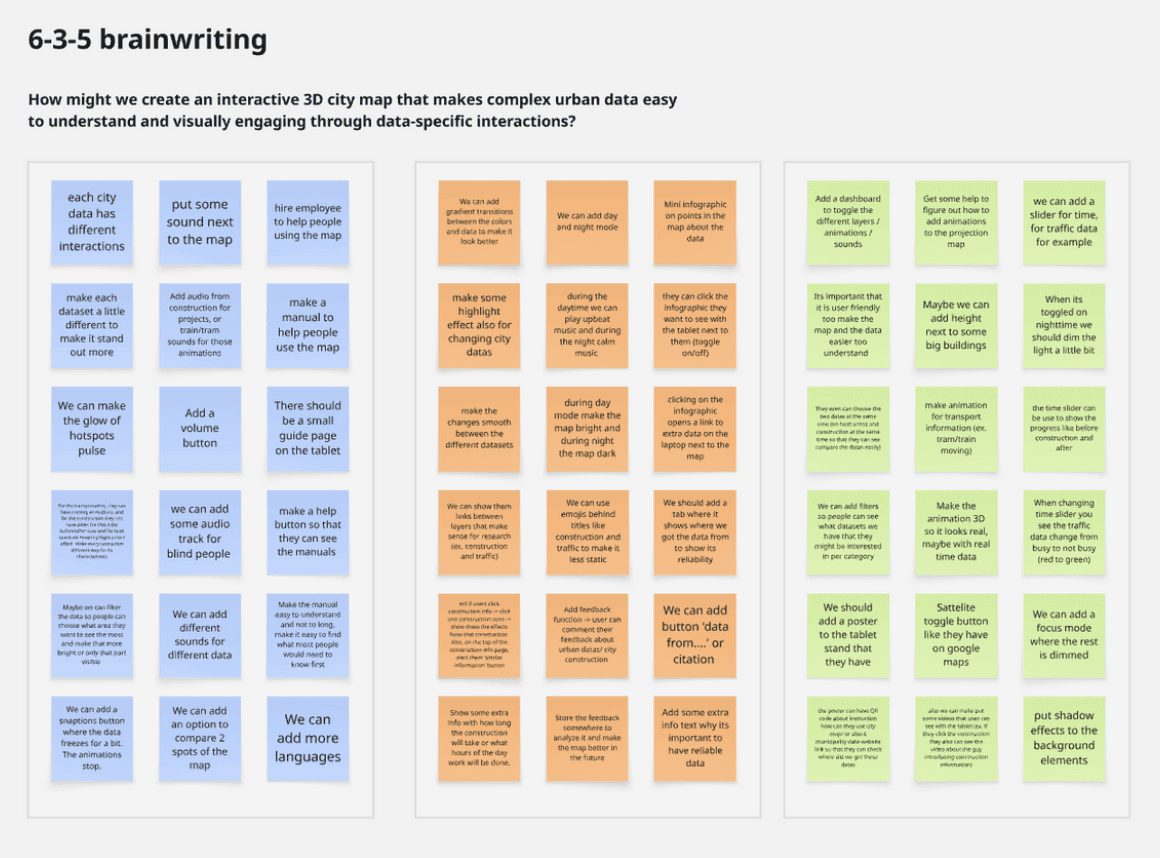
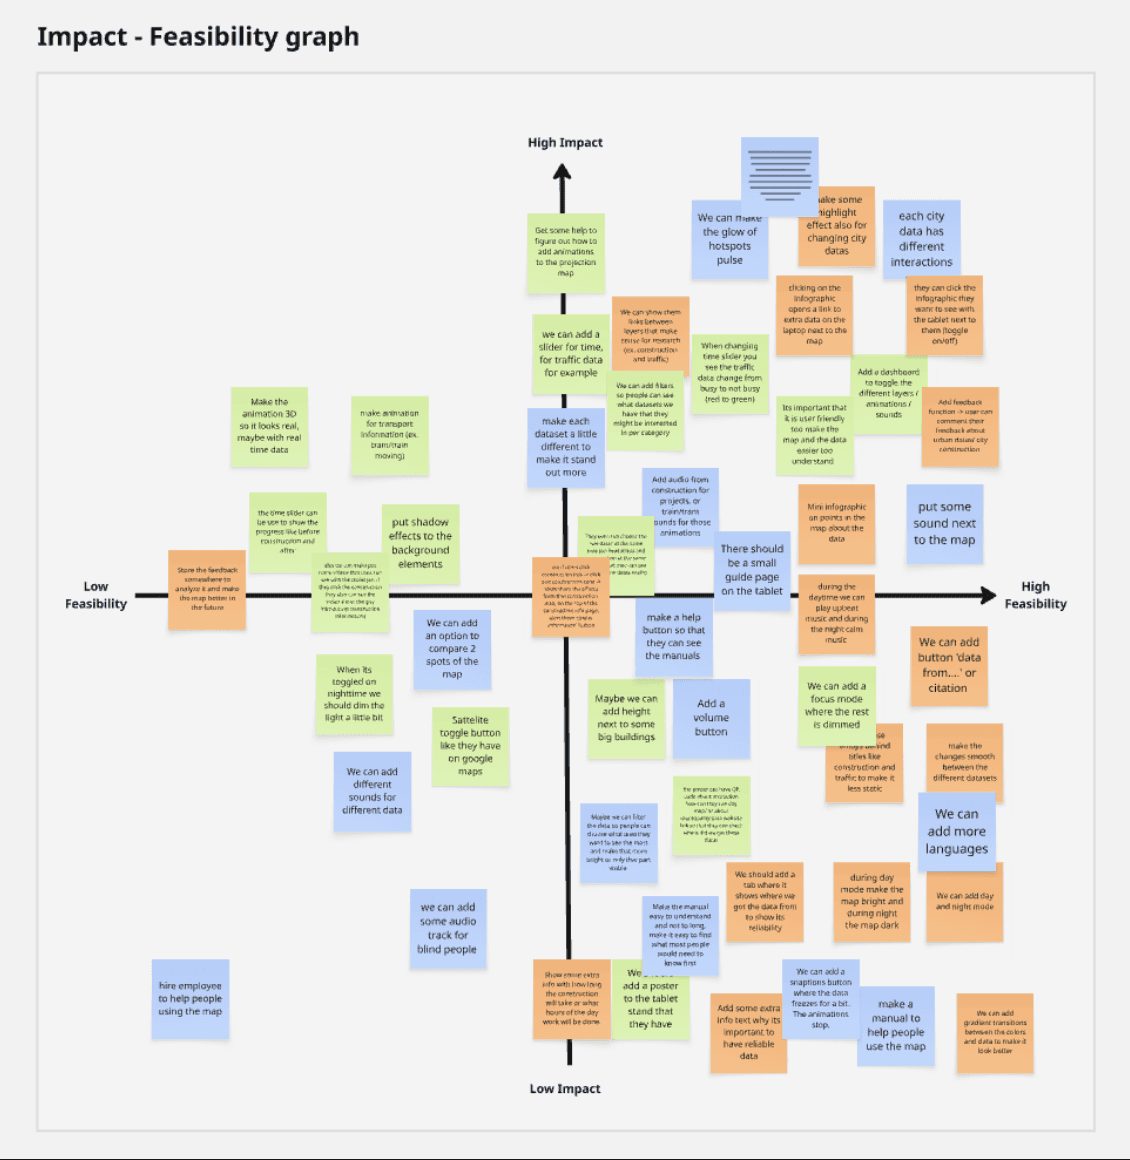
Ideas were generated in a 6-3-5 brainwriting session, clustered by theme in an affinity diagram, then rated on a feasibility–impact chart, building on the needs from the research.
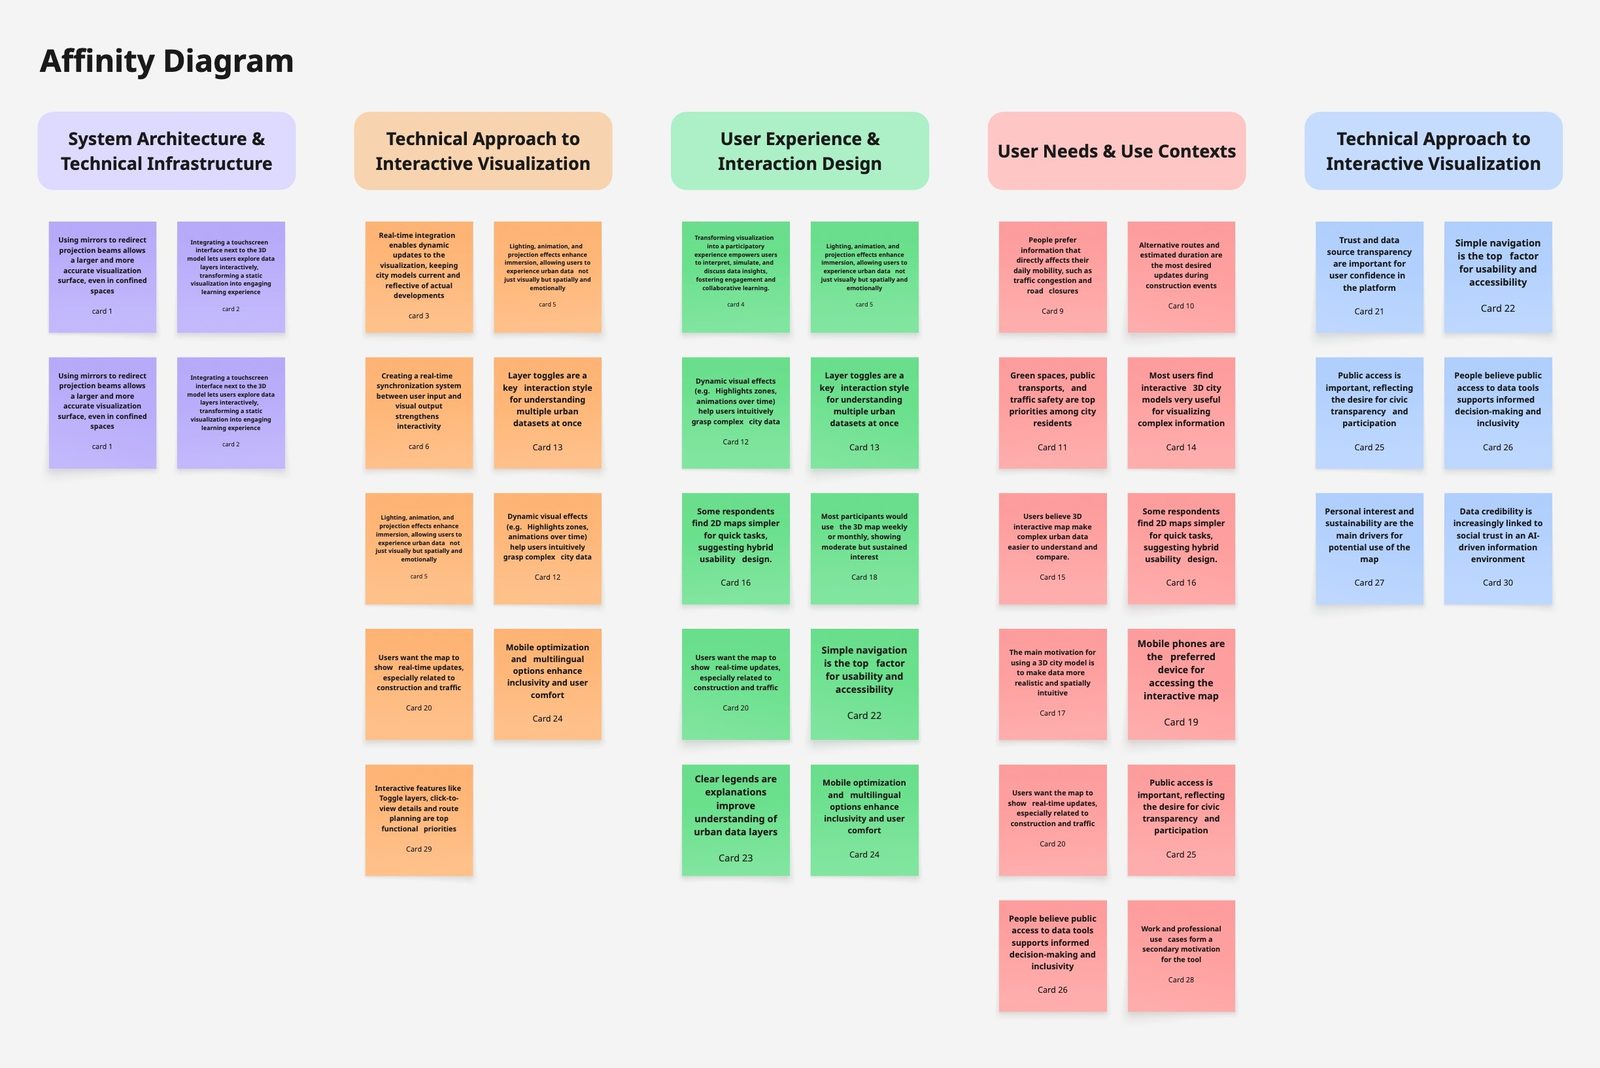
06 — Design direction
Four directions for the tablet interface
The research and the highest-scoring ideas became four directions for what the tablet shows and how it keeps a first-time visitor engaged.
- 01
Seven layers from research
Instead of every dataset the city holds, the interface offers the seven layers people asked for, so the menu stays short and every option feels relevant.
- 02
Sound for immersion
Matching sound plays with a projected layer, like traffic noise or nature sounds for green spaces, so the data is felt as well as seen.
- 03
Tools that fit each layer
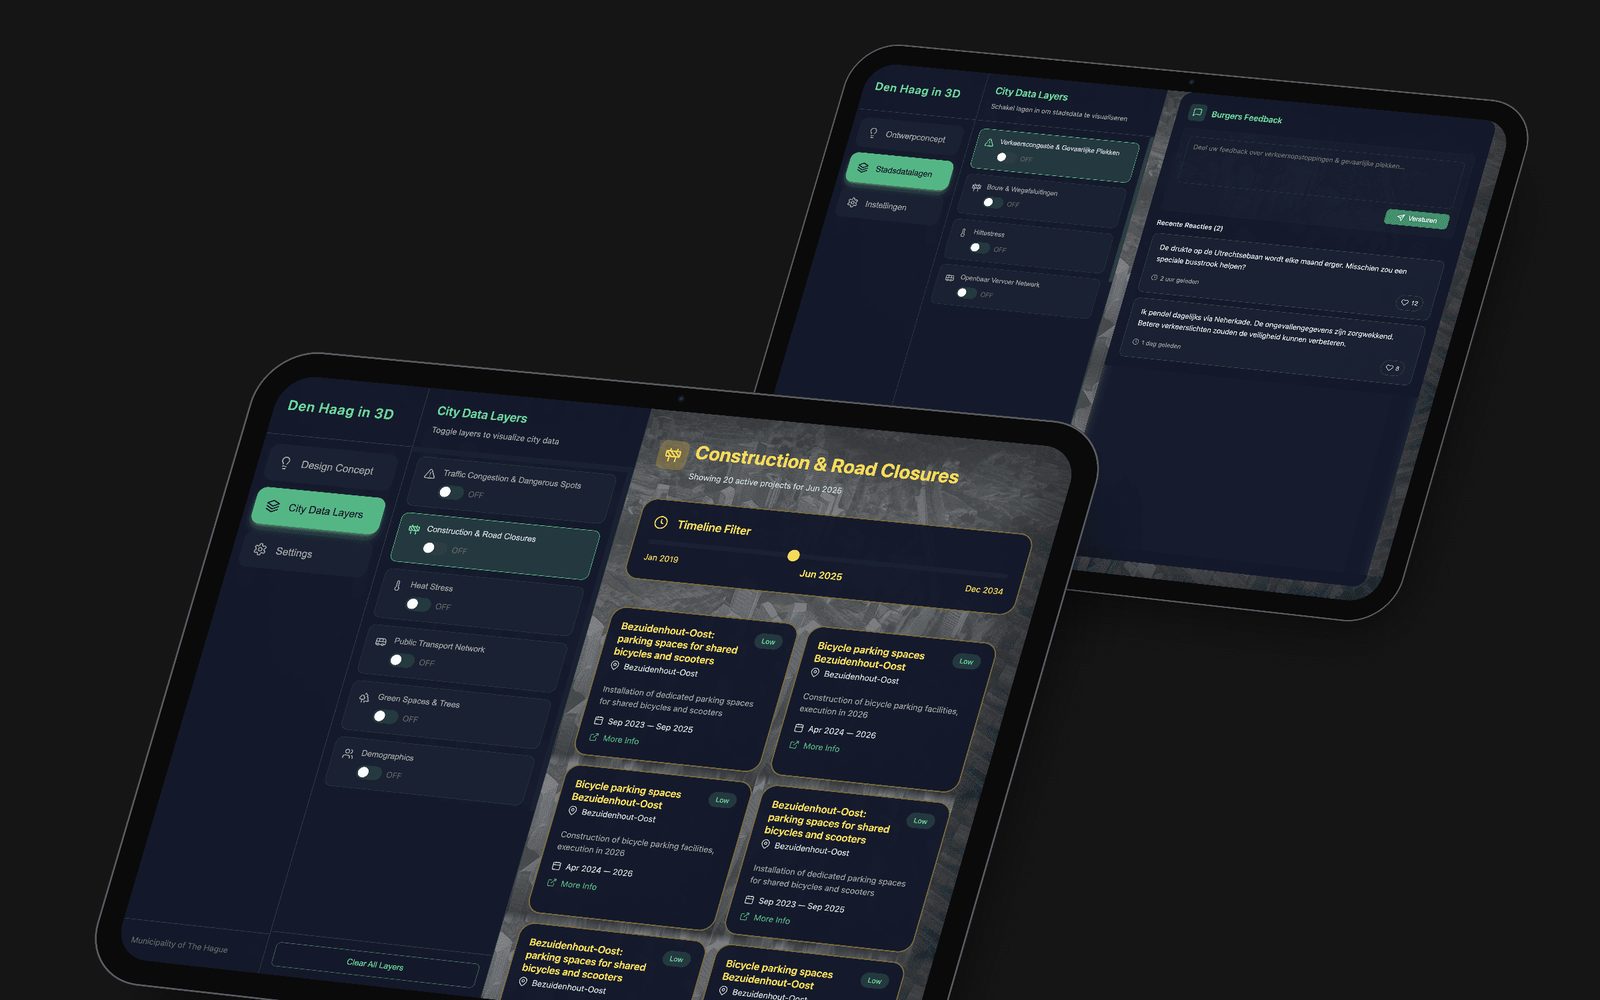
Each layer gets the tool that suits its data: a timeline filter to browse planned construction, and citizen feedback to react to traffic issues.
- 04
Easy for every visitor
An EN / NL language switch, plain layer names and a short start tutorial help first-time visitors get going without any help.
07 — UI design & development
A tablet that controls the city
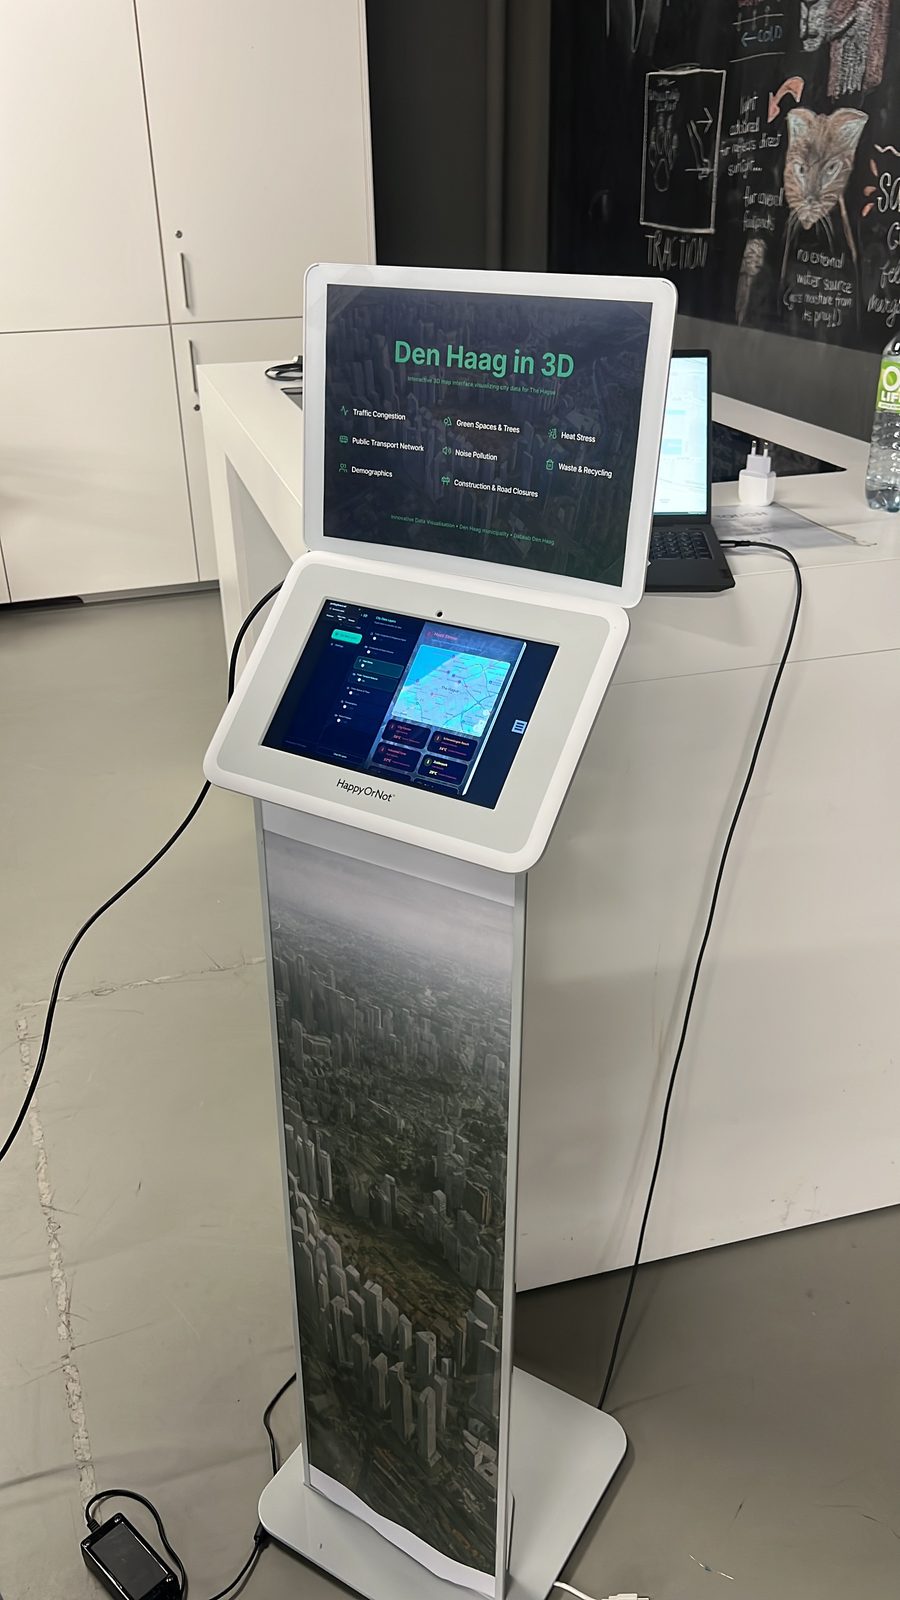
I designed and built the tablet interface with an AI-assisted 'vibe coding' workflow: Figma Make turned my designs into front-end code, and Cursor helped link every toggle to its ArcGIS layer, so each tap switches that layer's projection on the maquette in real time.
Two controls on every layer
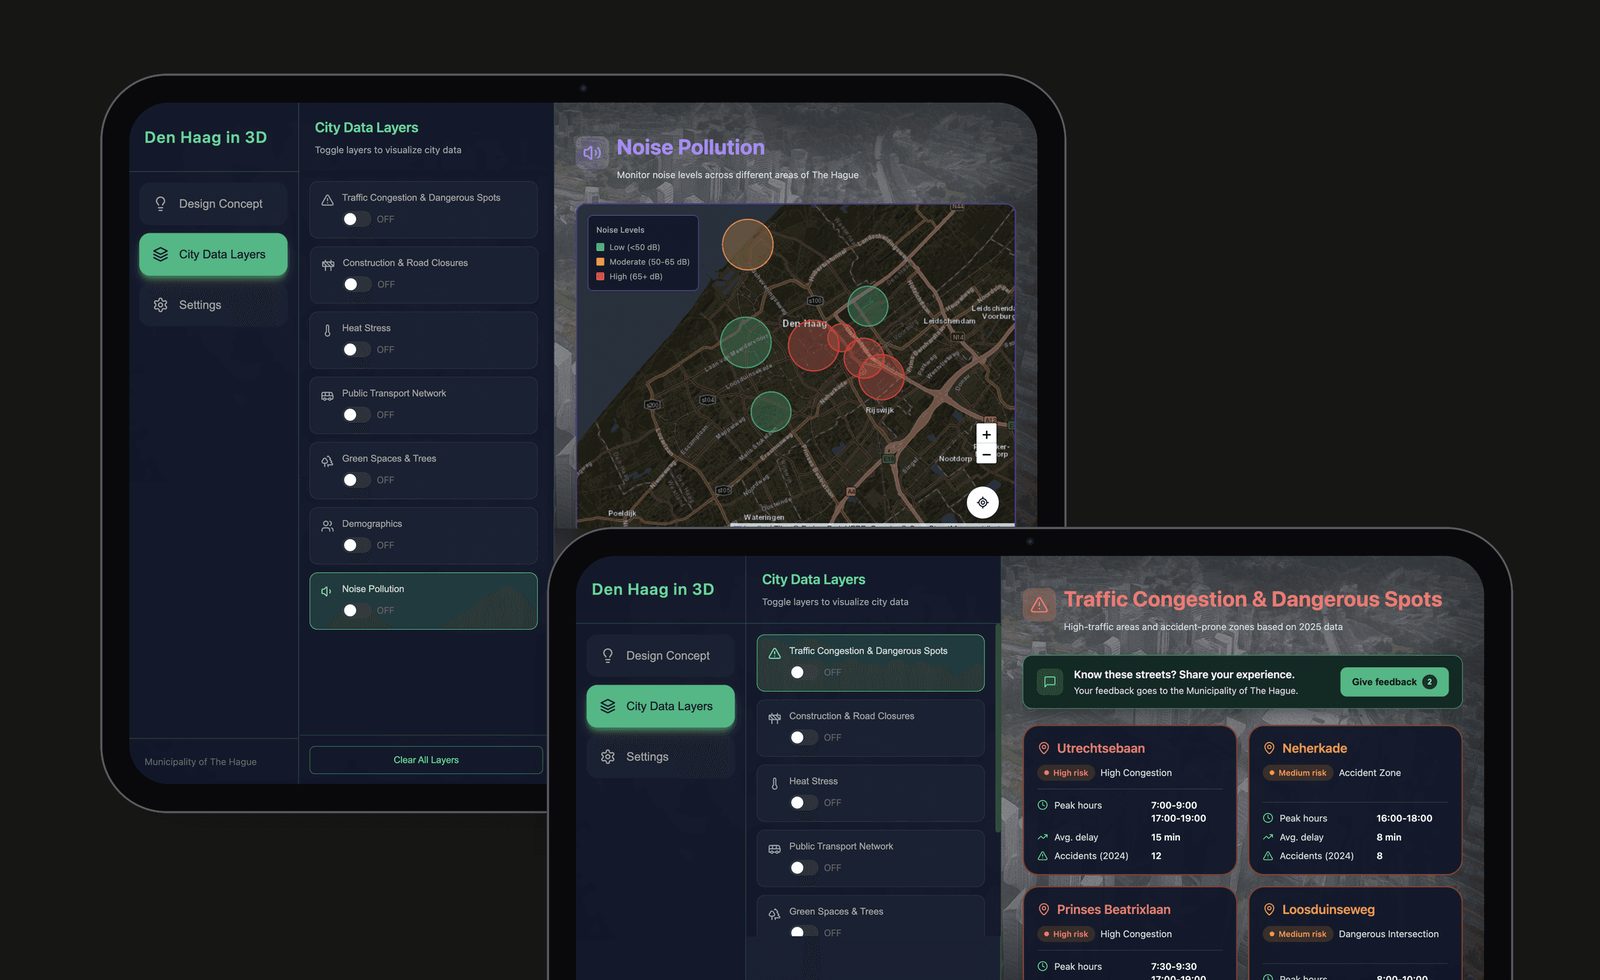
On the City Data Layers screen, every layer card does two things. Tapping the card opens that layer's details in the panel on the right. The toggle only switches its projection on the maquette on or off.
Why Keeping "show it on the model" separate from "tell me more" lets people steer the projection and read the details without one action getting in the way of the other.
Controlling the projection
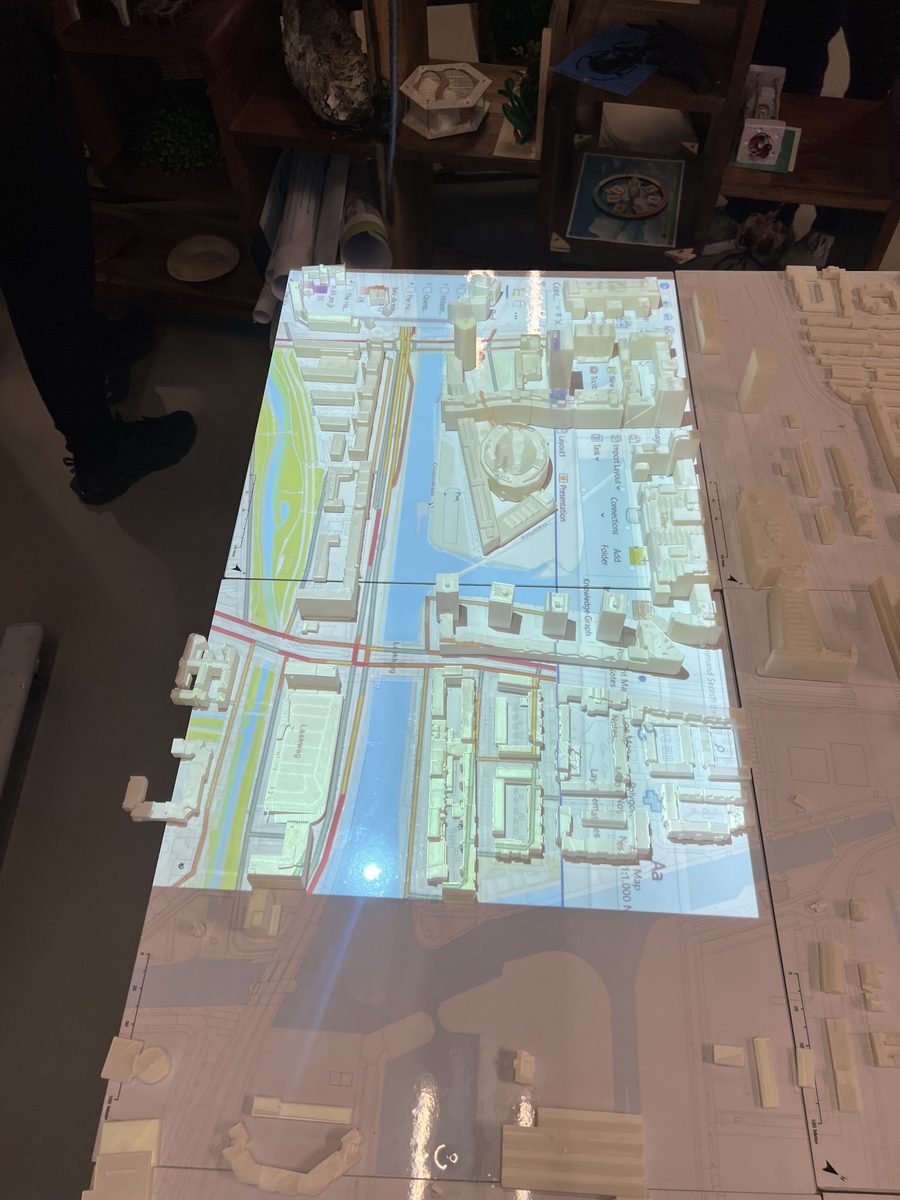
The tablet stands right next to the large 3D maquette of The Hague. Each toggle is linked to its layer in ArcGIS, which is projected onto the model, so one tap lights that data up on the real streets and buildings.
Why The maquette shows where something happens and the tablet explains what it is, so people can look up at the model and still stay in control.
On the 3D maquette
The tablet in use beside the maquette, with the selected layers projected onto the city model.
Why Visitors look at the model, not the screen, so every control had to work at a glance: large targets, clear on/off states and one-handed use.
08 — Testing & iteration
What the pilot test taught me
A task-based pilot test with five participants showed how first-time visitors used the tablet interface.
Pilot test scores (n = 5)
- 01
Discoverability
Not every element looked clickable, so toggles, icons and contrast got stronger.
- 02
Orientation
People wanted to know which area they were looking at. Next step: area labels.
- 03
Terminology
Some data terms were too technical. Next step: plain-language layer descriptions.
09 — Final exhibition
Exhibition day, 26 January 2026
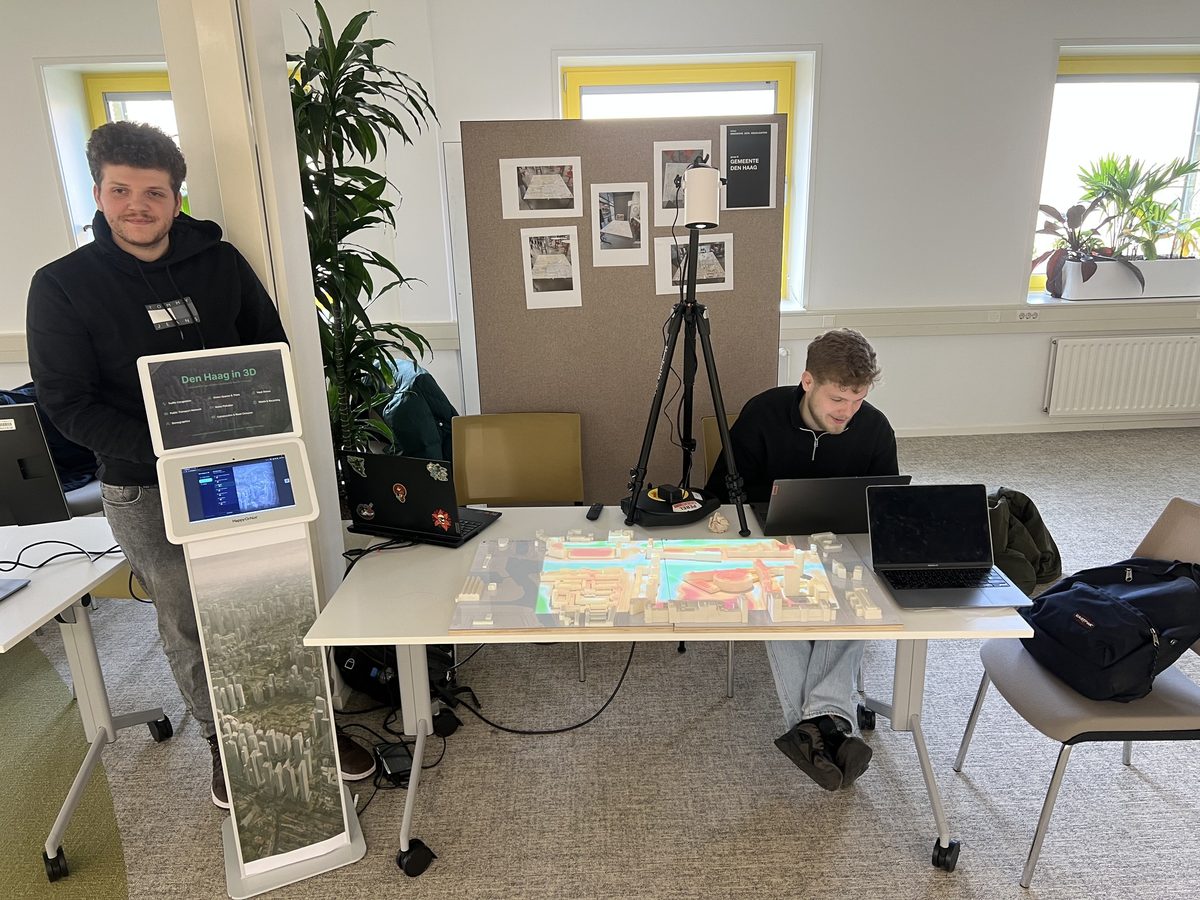
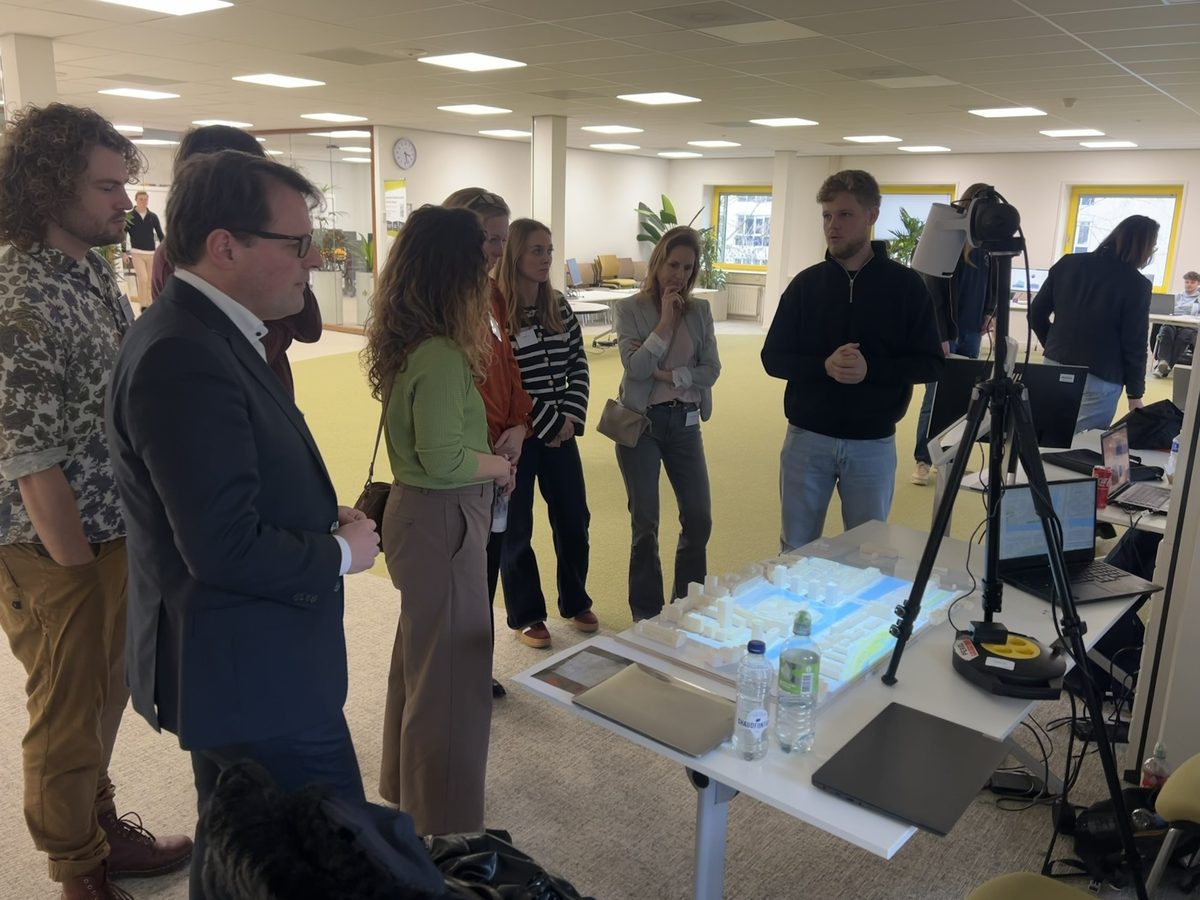
The installation was presented at the final exhibition, where visitors used the tablet to explore city data on the maquette.
Next project
 See case